How to Find the Thermocline on Your Fish Finder
Learn how to find the thermocline on your fish finder and use our free Great Lakes thermocline map to locate temperature breaks for salmon and trout trolling.
If you’re trolling for salmon, trout, or other game fish, knowing where the thermocline is can help narrow down the water column and focus your search. Instead of guessing where to set your downriggers, you can use the temperature break as a starting point for locating fish and bait.
What Is the Thermocline?
The thermocline is a transition layer where water temperature changes quickly with depth. During summer, deep parts of the Great Lakes can separate into three broad layers:
- Warm surface water: The upper layer, warmed by the sun and mixed by wind.
- The thermocline: The zone where water temperature drops rapidly as depth increases.
- Cold deep water: The colder water below the thermocline, which is often more stable.
Temperature can influence where fish and bait hold, but their locations also depend on forage, oxygen, light, currents, and season.
How to Find the Thermocline on Your Fish Finder
Most modern fish finders can show a thermocline on traditional 2D sonar. Whether it appears clearly depends on the temperature contrast, water conditions, and your unit’s settings.
-
Switch to Traditional 2D Sonar
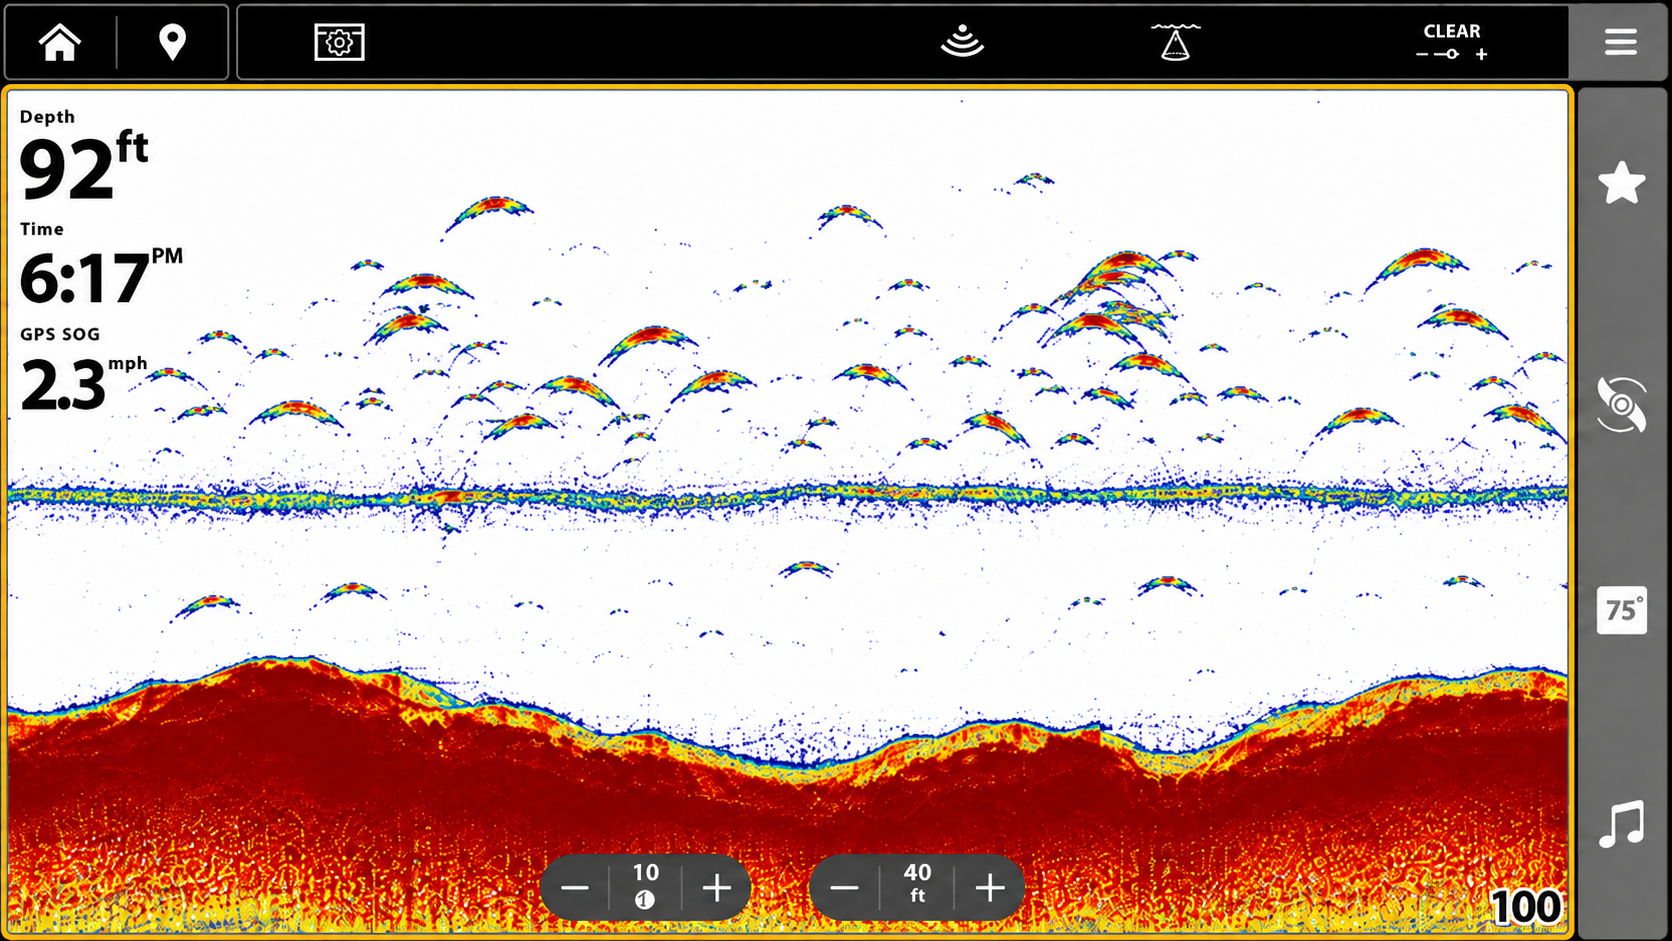
Start with your fish finder’s traditional sonar view. As you travel over deeper water, watch for a faint horizontal band that stays at a similar depth across the screen.
Unlike the lake bottom, which rises and falls with the terrain, a thermocline can appear as a relatively level, cloudy line in the water column. Some modern sonar views process returns differently, so check your unit’s manual if you’re unsure which view is traditional 2D sonar.
-
Increase Your Sonar Sensitivity
If you don’t see a possible temperature break, try increasing the sensitivity or gain a little at a time. A small increase can make a faint thermocline easier to see.
Too much sensitivity can fill the screen with clutter and make fish harder to distinguish. Adjust it gradually, and return to a clearer setting if the display becomes noisy.
-
Look for a Faint Horizontal Line
A thermocline may appear as a thin, fuzzy band or a wider layer of scattered returns. For example, if you’re trolling over 150 feet of water and a band holds near 60 feet as you move, it could be the thermocline.
That depth is only an example. Thermocline depth changes with lake, season, location, and weather, and a weak or absent temperature break may not show on sonar at all. Look for a band that persists over distance rather than treating one mark as a confirmed reading.
-
Look for Fish and Bait Around the Thermocline
Once you find a possible break, watch for fish arches and bait nearby. Salmon, steelhead, and lake trout may be above, within, or below the thermocline depending on temperature, food, and other conditions.
If baitfish and larger marks gather near the band, that can be a promising place to start trolling. A fish finder shows sonar returns; it doesn’t measure the actual water temperature at that depth. A downrigger temperature probe can help confirm the temperature where your gear is running.
Fishing the Great Lakes? Use Our Free Thermocline Map
If you’re fishing Lake Ontario, Lake Michigan, Lake Huron, Lake Erie, or Lake Superior, you can also check the estimated thermocline depth before heading offshore. The Great Lakes Trolling interactive fishing conditions map is free to use and doesn’t require an account.
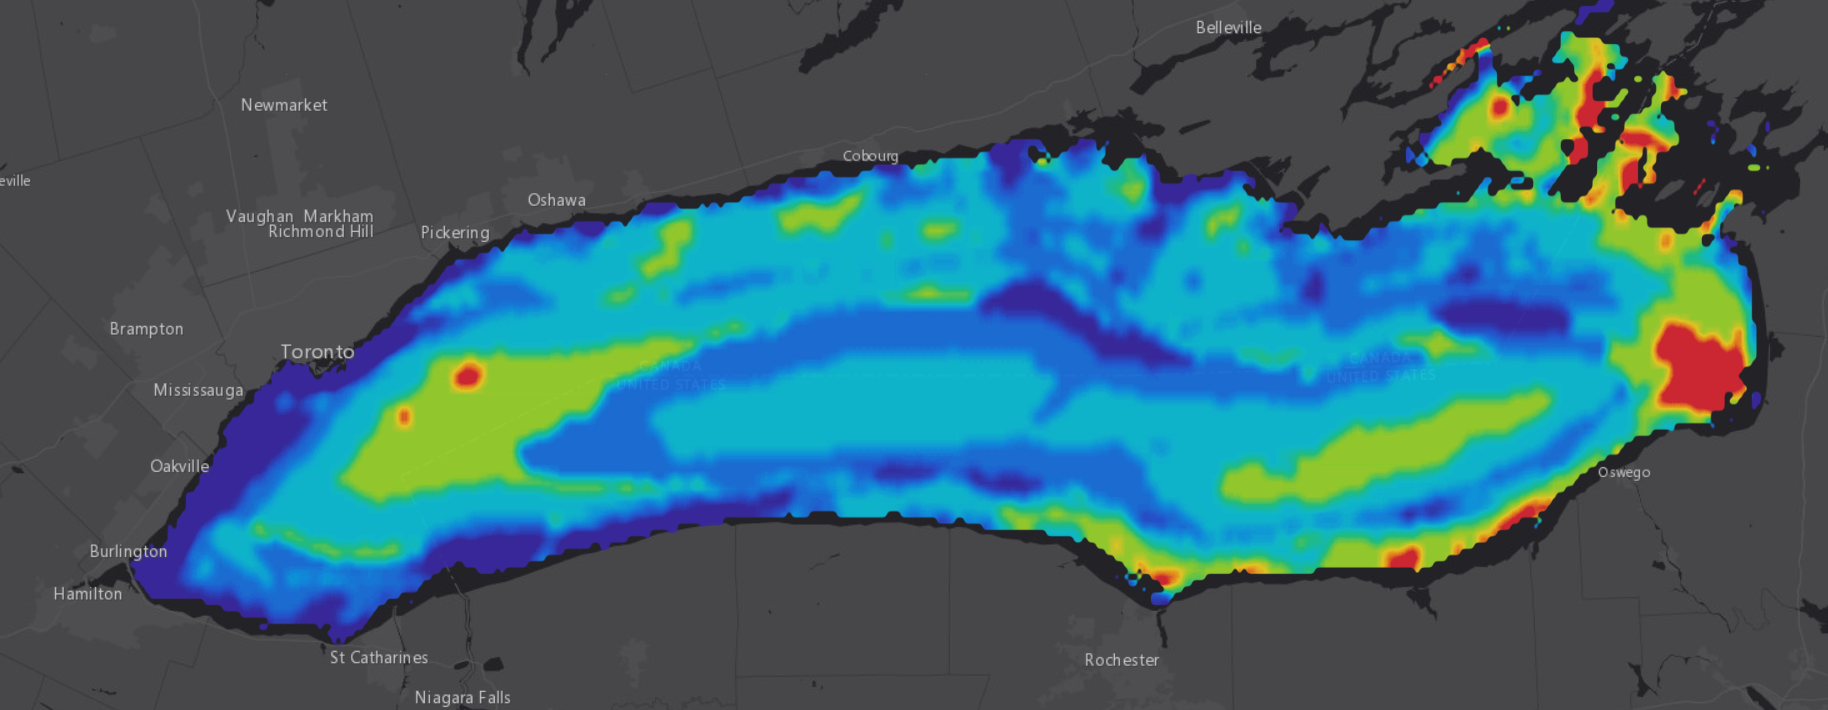
The map uses forecast model data to show underwater conditions. It gives you a wider view for comparing locations before you launch; it is not a direct temperature measurement beneath your boat.
How to Find the Thermocline on Our Map
- Open the interactive map.
- Pan and zoom to the Great Lake and fishing area you want to explore.
- Choose the Thermocline depth layer.
- Choose a forecast time to compare the estimated depth as conditions change.
- Click a location, then choose Water column in its reading to inspect the temperature profile when model data is available.
View the Free Great Lakes Thermocline Map
More Than Just a Thermocline Map
The map also provides other layers and readings to help you understand conditions below the surface:
- Water temperature at different depths: Compare modeled temperatures through the water column.
- Target-temperature depth: See where a selected water temperature occurs in the lake.
- Underwater currents: Explore modeled current speed and direction at different depths.
- Upwelling and downwelling: See modeled areas where colder or warmer water moves vertically.
- Wind and waves: Check forecast conditions before heading offshore.
- Depth contours: Compare lake-bottom shape with temperature and current conditions.
Use forecasts to plan your trip, then confirm conditions with your own electronics and current marine forecasts. Model estimates can differ from what you encounter on the water. Learn more about the map’s data sources and forecast limitations.