Water temperature at any depth
Compare temperatures from the surface to the lake bed and check conditions at your planned trolling depth.
 Great Lakes Trolling
For anglers
Built for anglers targeting salmon and other Great Lakes species, this map makes the water data they use to plan trips easier to find and compare. Check temperature at different depths, the thermocline, currents and waves, alongside measured buoy and shore-station readings across all five lakes.
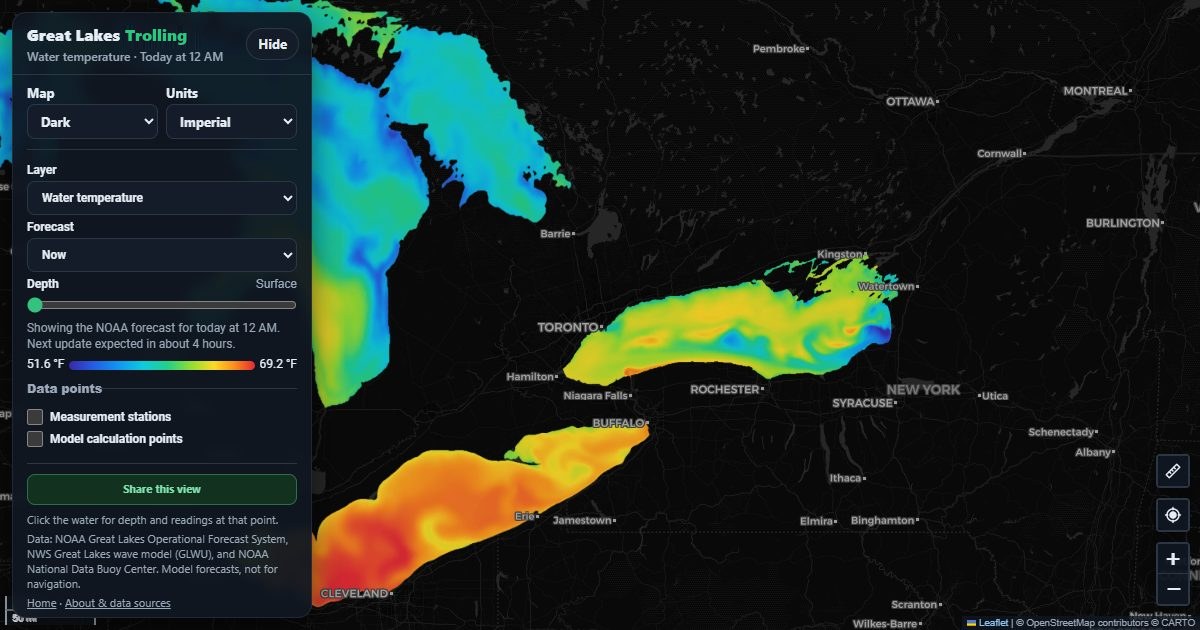
Compare temperatures from the surface to the lake bed and check conditions at your planned trolling depth.
See where warmer surface water meets colder water below, then compare that depth with where you're fishing.
Check current flow and speed at the surface or at depth in the part of the lake you're fishing.
Check wave height, period, and direction while planning time on the water.
Watch forecast conditions change over the next two days and compare possible times for your trip.
Click on a lake to compare temperature from the surface to the bottom, with the thermocline depth marked.
Compare model forecasts with measured temperature, waves, and current readings from about 70 NOAA buoys and shore stations.
Compare forecasts for your lake and planned depth, then check measured readings from buoys and shore stations. Lake forecasts update four times a day, waves every hour, and station readings as they report. See the data sources.
Water temperature, the thermocline, and currents come from NOAA's Great Lakes Operational Forecast System (GLOFS), a set of lake models run by NOAA's National Ocean Service. Waves come from the National Weather Service Great Lakes wave model (GLWU). Measured readings come from buoys and shore stations reported through NOAA's National Data Buoy Center.
NOAA runs the lake models four times a day (00, 06, 12, and 18 UTC) and publishes each run about 2.5 to 3.5 hours later. The wave model runs every hour. The server downloads new runs automatically as soon as NOAA publishes them, and the "Now" view moves forward every hour.
In summer and early fall, large lakes separate into a warm surface layer and a cold deep layer. The thermocline is the band between them where the temperature drops quickly with depth; the map shows where it starts. Many anglers fish near it, because temperature-sensitive fish such as salmon and trout often hold close to it.
Yes. A depth slider shows modelled water temperature and currents from the surface down to the bottom, and clicking any point on a lake opens a full water-column profile from the surface to the lake bed.
Yes. The map is free to use with no account. It is built on public NOAA data.
No. These are computer model forecasts and estimates. Always check official NOAA forecasts, marine warnings, and charts before going out on the water.